What is Insights?

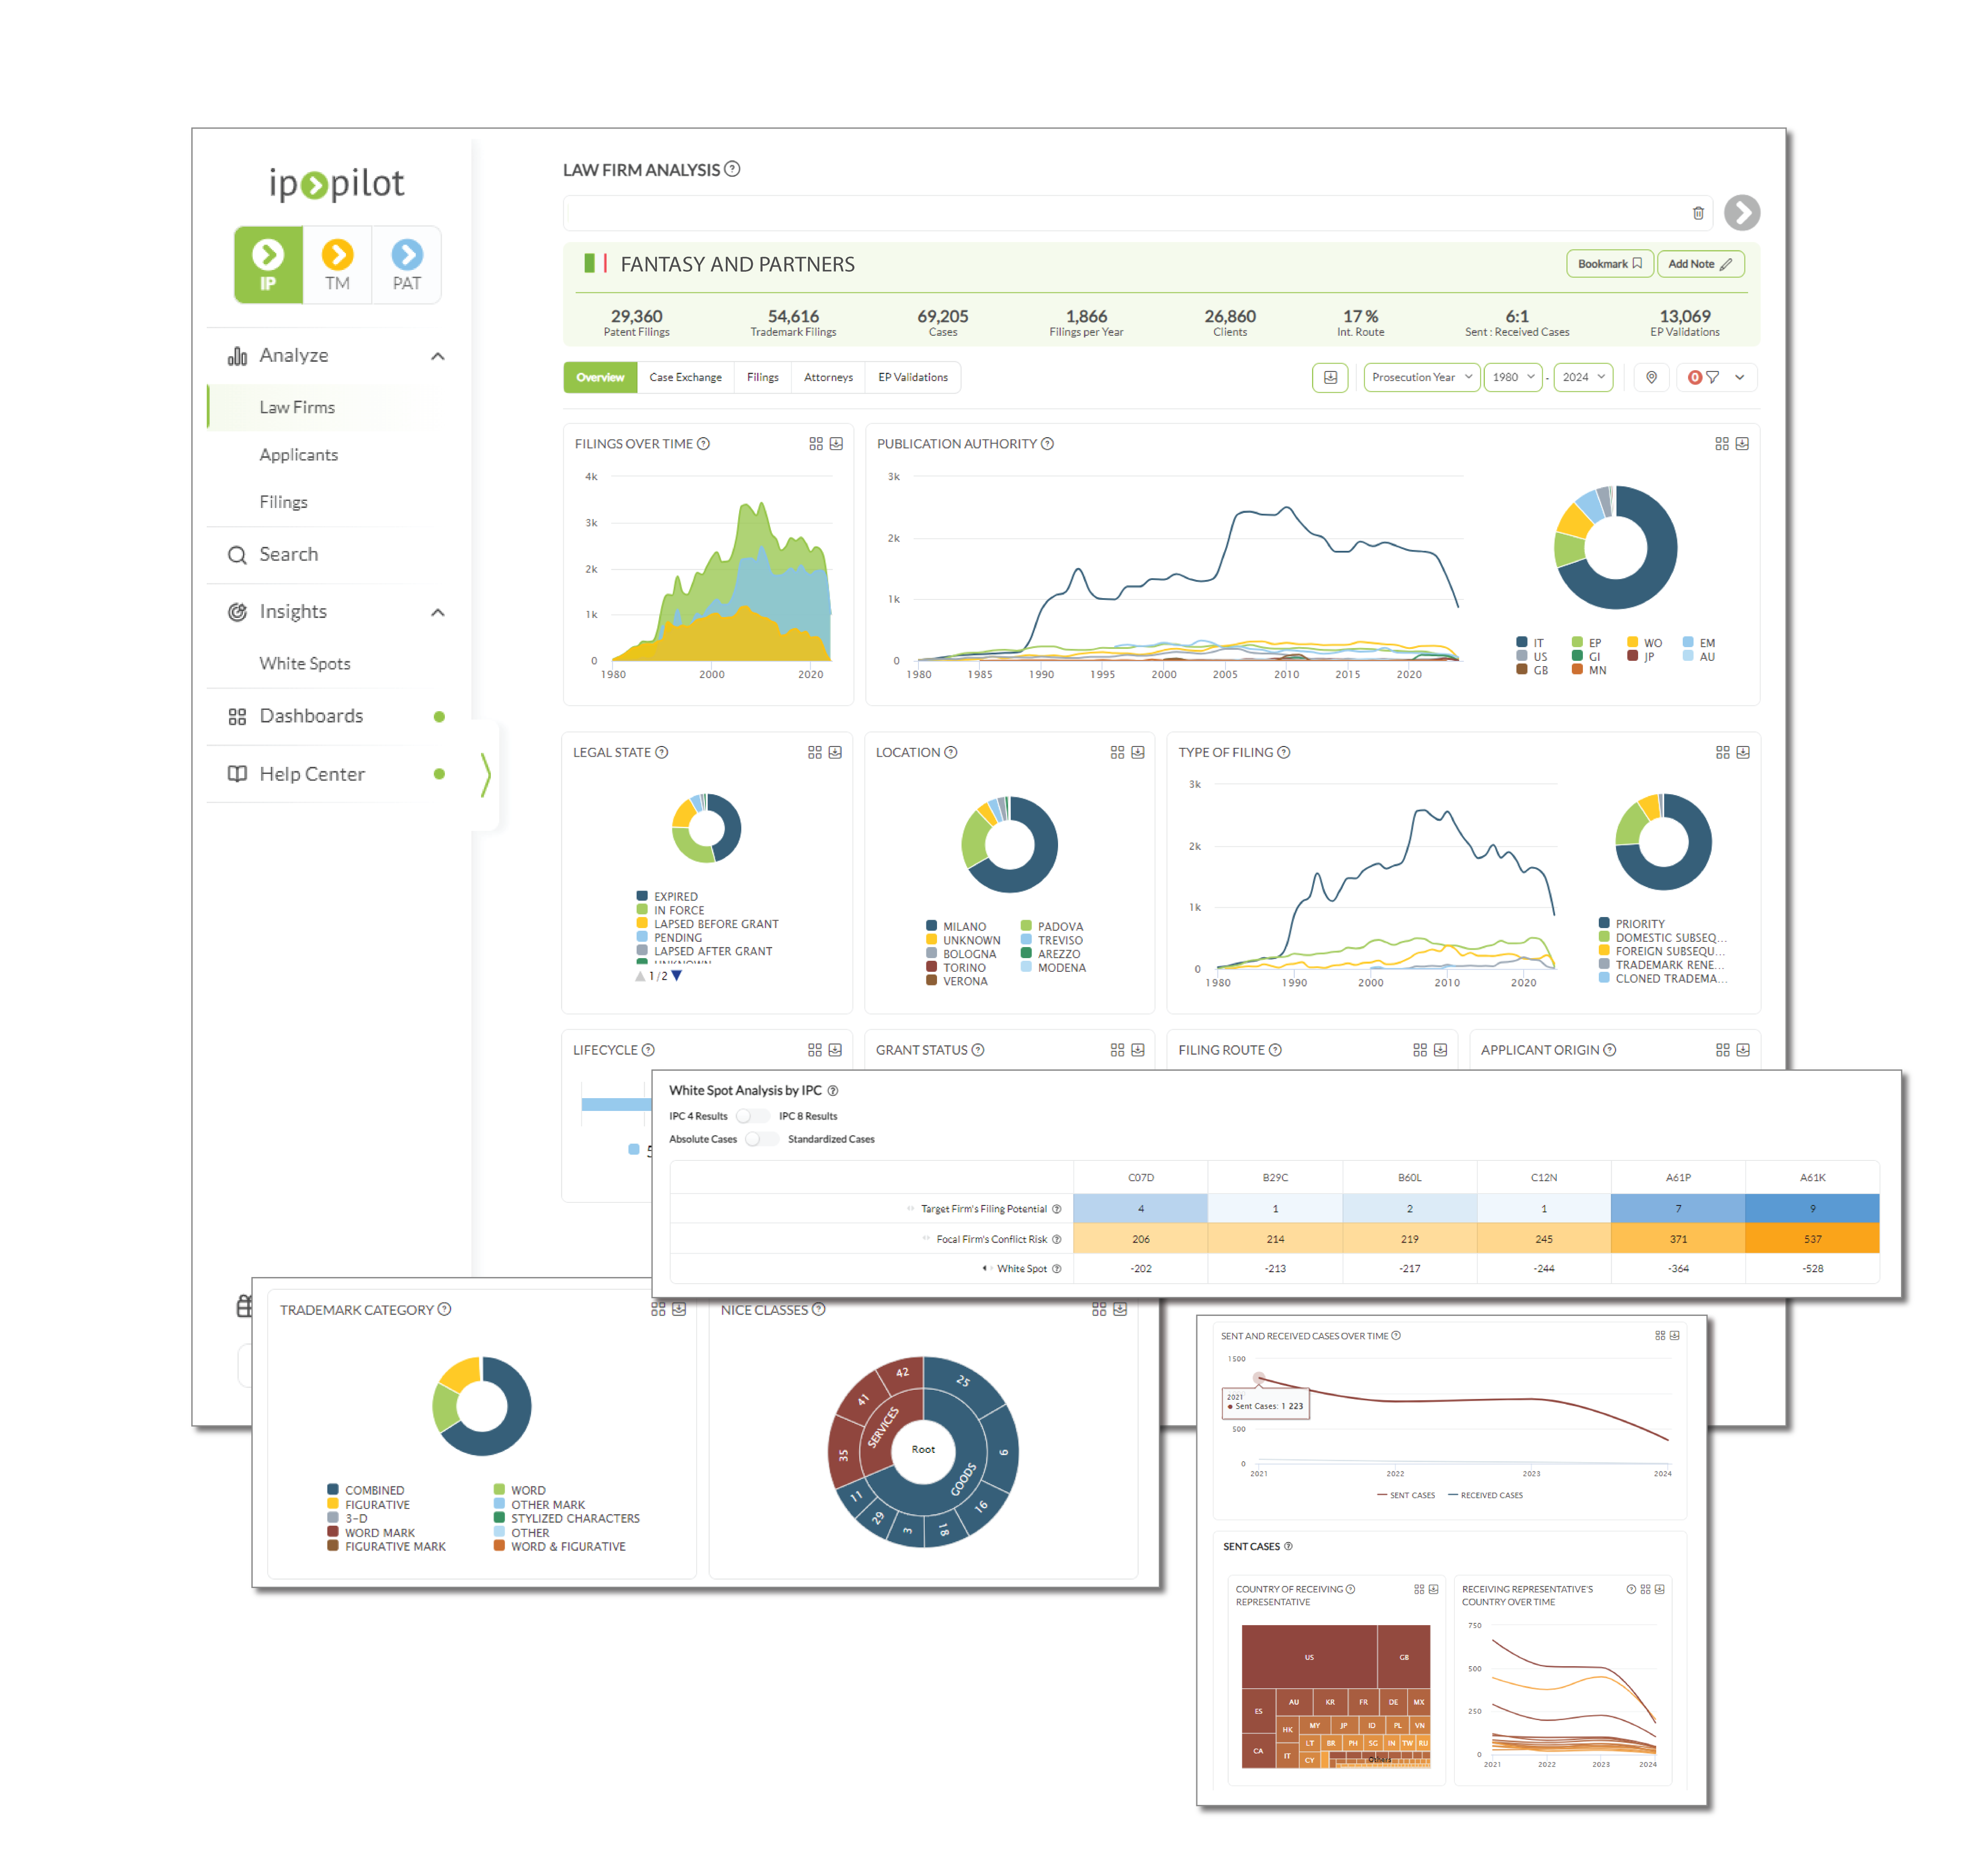
Insights presents a set of features built by advanced big data analysis. This section provides information such as which are the most promising and high-risk technical areas to collaborate with existing or potential clients and partners (White Spot Check), and much more.

White Spot Check

White Spot Check (WSC) reveals the technical overlap between entities by directly comparing them.

To do so, the algorithm behind WSC uses IPCs to relate the technical profile of, for example, the focal firm (your firm) to another law firm (target firm) or applicant. In other words, it relates the target’s filing potential to the focal firm’s conflict risk and reveals IPCs with the most significant white spots.

Comparing technical profiles of law firms

1. Under Insights of the side menu, select White Spot Check.

2. Type the name of the focal firm (typically the name of your own firm).

3. Type the name of the target firm – typically the name of a partner which you are considering to cooperate with.

4. Click Check White Spots button to get the results.

Result Interpretation

The two tables, namely the “White Spot Analysis by IPC” and “Patent Case Volume per Client and IPC,” show the critical output of the Analysis.

In the first table, you will find the “Target Firm’s Filings Potential.” It shows the IPCs where the target firm has volumes that the focal firm could potentially take over in the domestic market.

In other words, you can see how many patent cases the target firm has sent to the focal firm’s jurisdiction. It is important to note that we take only the cases where the target law firm was a decision maker.

The second table meanwhile shows the target firm’s clients in each of the IPCs and the relevant number of cases associated with each of those clients. Presumably, these patent cases can be taken over and represented by the focal firm in its domestic jurisdiction.

Next, the WSC’s algorithm compares the focal firm’s portfolio against the portfolio of a target firm. As a result, the “Focal Firm’s Conflict Risk” part of the “White Spot Analysis by IPC” table reveals how many patent cases the focal firm has already represented in the outlined IPCs.

If you slide the switcher button to the “Clients of focal firm” side, you can find the list of the focal firm’s existing clients which can potentially create a conflict of interest and the volumes the focal firm has prosecuted for them in each relevant IPCs.

Lastly, the “White Spot,” which is the filing potential and conflict risk delta, shows the most promising and riskiest IPCs. The higher the potential and/or the lower the risk, the bigger the White Spot in an IPC.

Note that in the analysis, we consider the overall portfolio for the target law firm and only the domestic portfolio for the focal law firm.

Important to know

Standardized cases normalizes each country’s number of patent families on a scale of 0-10. The standardization is helpful to make countries quantitatively more comparable since jurisdictions vary significantly in terms of patent filing volumes. To compare normalized values instead of the number of patent cases, you will need to switch the toggle button from “Absolute Cases” to “Standardized Cases”.

Additionally, you can choose between IPC4 and IPC8, depending on the level of precision you would like to achieve.

Comparing technical profiles of a law firm and an applicant

1. Under Insights of the side menu, select White Spot Check.

2. Switch from “Law Firms” to “Applicants” tab.

3.Type the name of the focal firm (typically the name of your own firm).

4. Type the name of the target applicant.

5. Select authority i.e. the offices at which the focal firm (you) would represent the respective target applicant.

6. Click Check White Spots button to get the results.

Result Interpretation

The two tables show the critical output of the analysis.

To begin with, “The White Spot Analysis by IPC” reveals the “Target Applicant’s Filing Potentials” or, in other words, how many cases the selected applicant has sent to the selected jurisdictions in the outlined IPCs. There are volumes that the focal firm could potentially take over.

Further, “Focal Firm’s Conflict Risk” discern how many cases the focal firm has already prosecuted in the displayed IPCs. It also gives an indication of the focal firm’s expertise in those technical areas.

The table below reveals the list of clients whom Fantasy & Partners has represented in the indicated IPCs alongside the associated volumes.

As in the law firms-related comparison, “White Spot” is the delta between the two values, implying that the higher the potential and/or the lower the risk, the bigger the White Spot in an IPC.

Here, the high value might signal that there is a good potential for cooperation in a certain technical field when approaching a new client.

Important to know

Standardized cases normalizes each country’s number of patent families on a scale of 0-10. The standardization is helpful to make countries quantitatively more comparable since jurisdictions vary significantly in terms of patent filing volumes. To compare normalized values instead of the number of patent cases, you will need to switch the toggle button from “Absolute Cases” to “Standardized Cases”.

Additionally, you can choose between IPC4 and IPC8, depending on the level of precision you would like to achieve.