
This article covers every way to get data out of IP Pilot. You can export a single chart, a table of filings or a whole profile as a PDF. You can also export data for up to 1,000 entities at once. For example, you can put one Case Exchange chart into a pitch deck, or send a colleague a firm’s full profile as one PDF.
Each export control sits on the screen that holds the data, and the file format depends on the control. This article explains each control. The features themselves have their own articles.
An export uses the view on your screen. Set the year range, the year type and your filters before you export. Navigating the App explains these controls.
1. Choose the right export #
| Control | Where you find it | What you get | Use it for |
|---|---|---|---|
| Export Chart | Every chart and table on a law firm or applicant profile, every chart in a Custom View, and the Insights result panels | JPG, PDF, XLSX or SVG, from a dialog. Some charts offer fewer formats | One chart for a slide or a report |
| XLSX Table Export | The Filings tab of a profile, and the result views in Search | An XLSX spreadsheet, with no dialog | A list of filings or entities to work with in a spreadsheet |
| Export Profile | The control bar below the profile tabs | One configurable PDF | A whole profile as one document |
| Export Comparison | Each chart in Compare Entities | JPG, SVG, PDF or XLSX, from a short menu | One comparison chart |
| Excel Autofill | Its own feature | One filled spreadsheet | The same data points for up to 1,000 entities |
Export needs Standard or Pro. It is not available on trial access. Excel Autofill needs Pro.
2. Export a single chart or table #
Every chart and table panel on a profile has three icons to the right of its title. They are a grid icon (Add to dashboard), a download icon (Export Chart) and a plus icon (Add to custom view). The download icon is the export.
- 1Click the download iconHover over the icons to the right of the chart title and click the download icon (Export Chart). The Export Chart dialog opens.
- 2Choose a formatSelect one of the format tabs: JPG, PDF, XLSX or SVG. JPG is selected by default. Some charts offer fewer formats.
- 3Set the togglesSwitch on Header, Footer, Entity context or Legend as you need.Note: All four toggles appear on every format tab, but their defaults differ. On the PDF tab, all four start on. On the JPG, XLSX and SVG tabs, all four start off. Check them each time you change the tab. With all four off, the file contains the chart only.
- 4ExportClick Export. To close the dialog without a file, click Cancel.
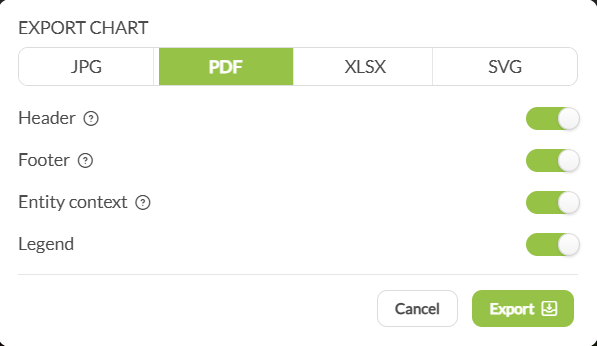
Why Entity context matters. Entity context writes the entity name and the applied filters into the file. For a profile that combines several entities, it also writes the list of those entities. Without it, the file does not show which entity or which filters produced the chart.
XLSX gives you the numbers behind the chart. SVG is a vector file, so you can resize it without loss of quality. Charts in a Custom View use the same Export Chart dialog, so you export a view one chart at a time.
The result panels of Similar Entities, Network Overlap and Tech Overlap also have the download icon (Export Chart).
3. Export rows of filings or entities #
The Filings tab of a profile and the Filing View in Search list individual filings. Both have a Selected Fields dropdown on the left and an XLSX Table Export button on the right. The button has no dialog. It downloads the spreadsheet immediately, so choose the columns first.
- 1Filter the listApply filters until the table shows only the filings you need. The export contains the rows in the table, so filters also keep the file to a workable size.
- 2Choose your columnsOpen Selected Fields and select the fields you need.
- 3Click XLSX Table ExportThe file downloads immediately.Note: There is no confirmation step. If you forget a column, you must export again.
Selected Fields offers 31 columns: Application Number, Original Application Number, Applicant, Representative, Title or Verbal Element, Category, Type of Filing, Prosecution Date, Filing Date, Publication Date, Grant Date, Case Exchange Date, Legal State, PCT Deadline, Application Type, Filing Route, Grant Status, Lifecycle, Attorneys, Representative Type, Corresponding Application Numbers, Decision Maker, Origin Authorities, Origin Representative, Target Authorities, International Representatives, IPC Sections, IPC Symbols, Technical Sectors, Technical Fields, Nice Classes. Filings explains what each field means.
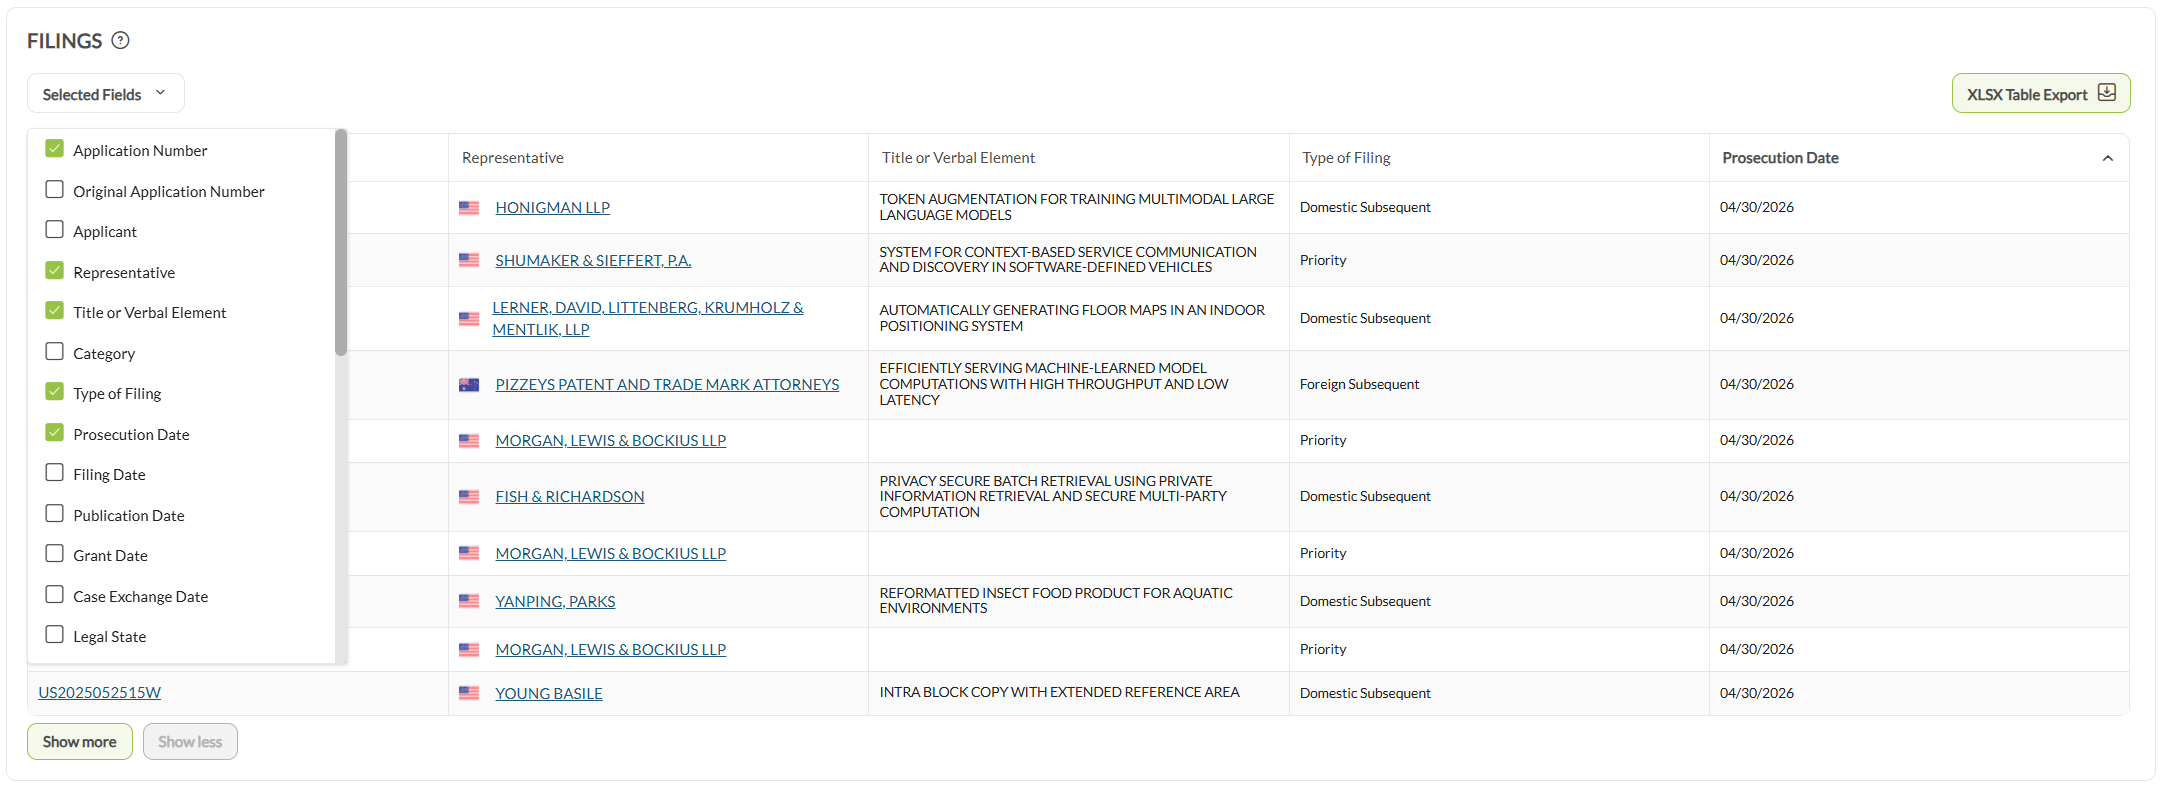
In Search, List View has the same XLSX Table Export button without Selected Fields, because each row is an entity, not a filing.
Search shows at most 1,000 results, and the export has the same limit. When a search reaches the limit, a banner reads “Only showing most relevant 1000 results. Please add additional constraints if you want to narrow down your search.” The table shows 100 rows per page. To get a complete list, add constraints to the search instead of exporting it again. For data on a list of entities you already know, use Excel Autofill.
4. Export a whole profile as a PDF #
You can export a whole profile as one PDF instead of chart by chart. The control is a download icon (Export Profile) in the control bar below the profile tabs. It is to the right of the CRM button, which has a pro badge.
- 1Open the dialogOn a loaded profile, click the download icon (Export Profile) in the control bar below the tabs. The Export Profile dialog opens.
- 2Choose the chartsThe dialog lists the profile’s charts in one column per tab: Overview, Case Exchange and About. An EP Validations column is added if your subscription includes the EP Validations data pack. Select charts one by one, or use the Select All checkbox at the top of a column to take a whole tab.Note: A profile has dozens of charts, so a full selection gives a long document. One column is often enough.
- 3Choose the year typeUse the Date Type dropdown below the columns. The table below this procedure explains the options.
- 4Set the page optionsChoose a Paper Type: A4 (the default) or Letter. Select Include glossary if the reader does not use IP Pilot. It is off by default.
- 5Generate the PDFClick Preview PDF. A progress message with the entity name reads Profile export in progress… while the document is built. When it is ready, the message reads Profile successfully exported.
| Date Type | Dates each chart by | Use it for |
|---|---|---|
| Most Appropriate Year (default) | The year type that each tab uses on screen | A general read of the profile |
| Always Prosecution Year, Always Publication Year, Always Filing Year, Always Grant Year, Always Case Exchange Year | That one year type, on every chart | A document that must be read on one basis, for example when you compare it with your own records |
Note: Preview PDF does not show a preview. It starts to build the full document. Make your selections before you click it, and expect a wait for a large selection.
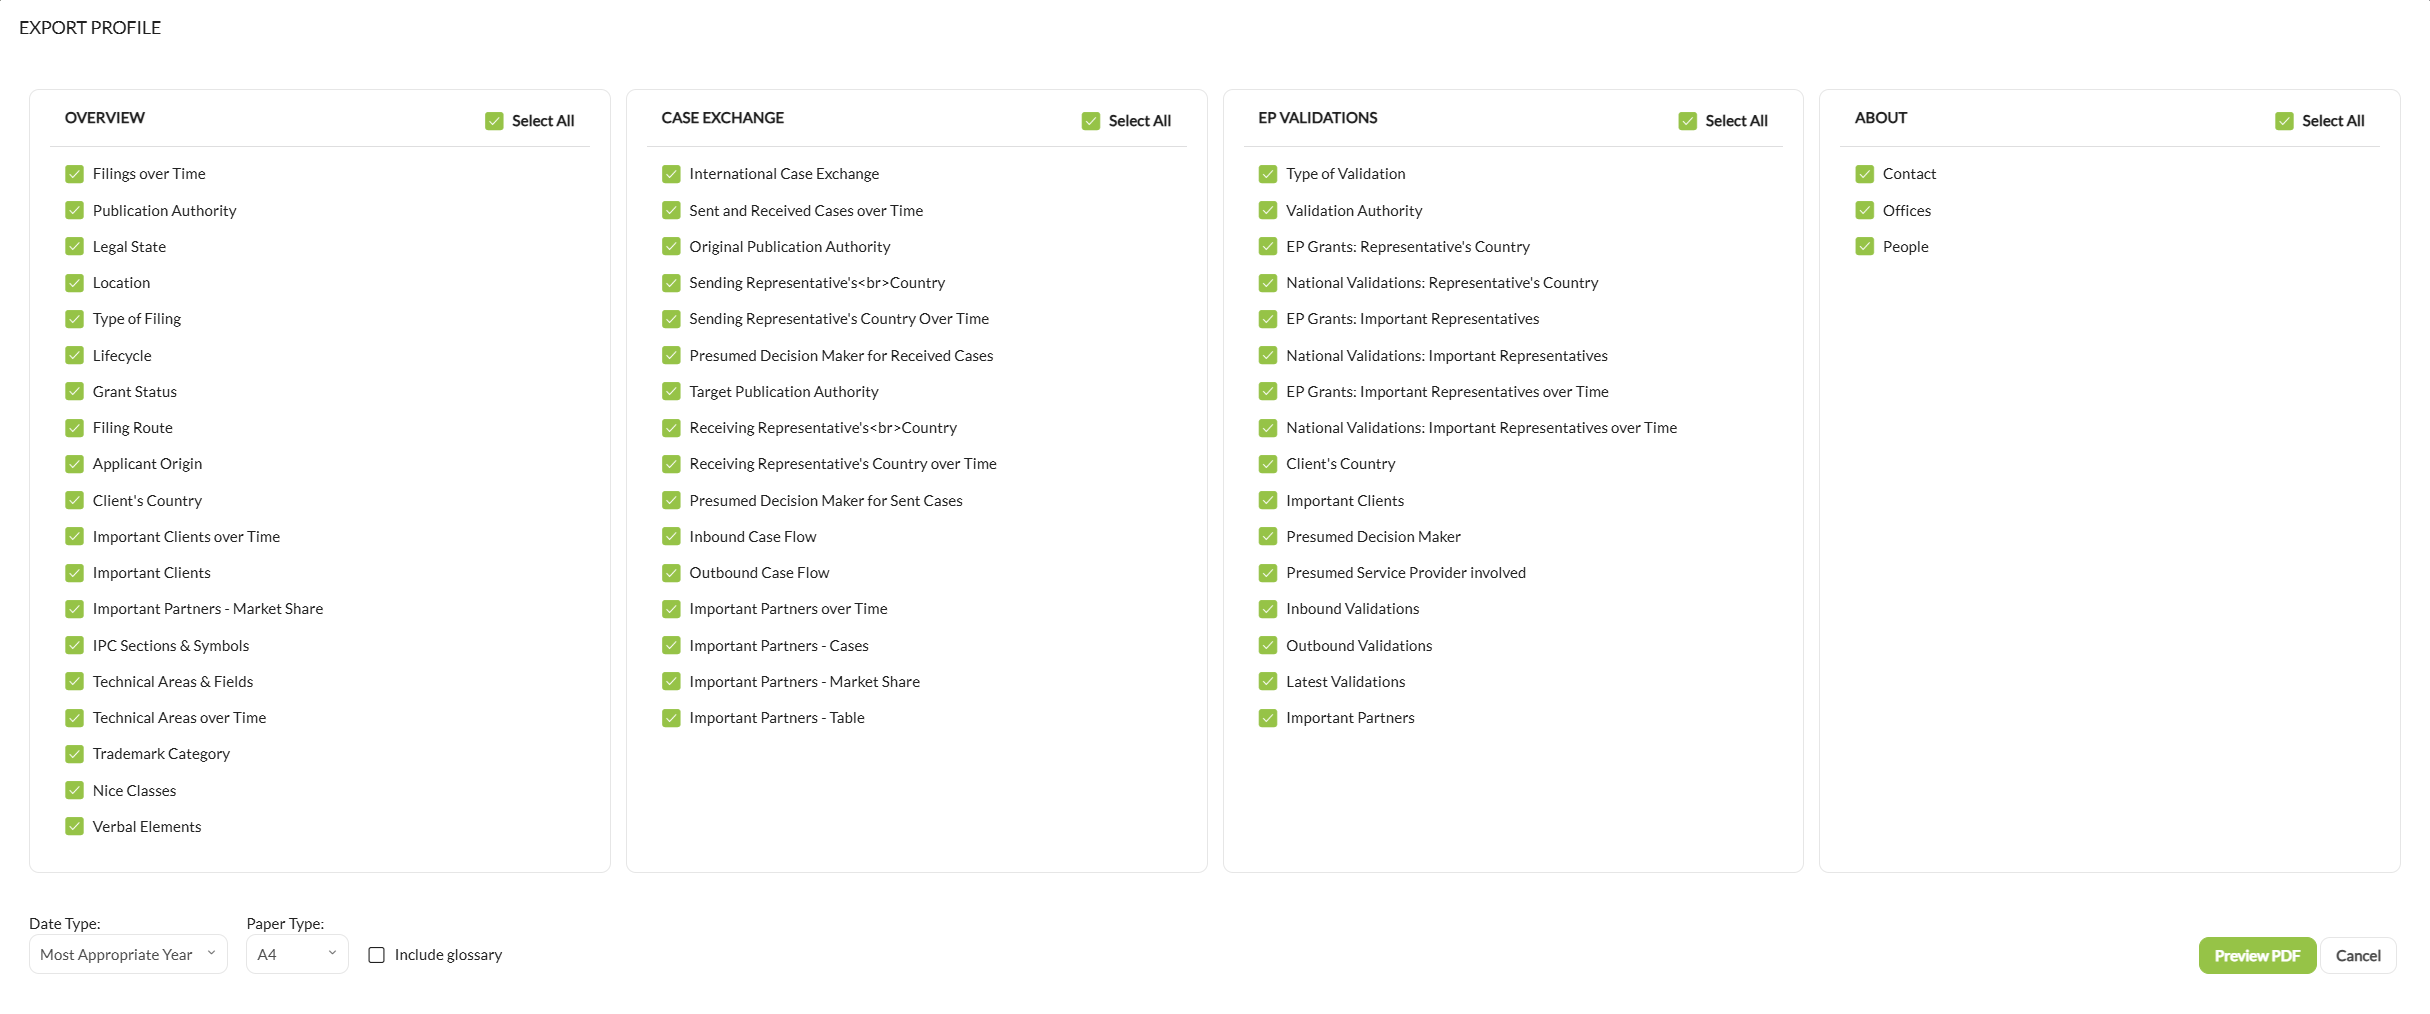
Applicant profiles work the same way. Only the chart lists are different. They cover the applicant’s representatives instead of a firm’s clients, and the About column adds Connected Entities. For what each chart shows, see Law Firms and Applicants.
5. Export a comparison chart #
Compare Entities uses a different control. Each comparison chart has an icon (Export Comparison). It opens a short menu instead of the Export Chart dialog: Download as JPG, Download as SVG, Download as PDF and Download as XLSX. There are no Header, Footer, Entity context or Legend toggles.
You export a comparison one chart at a time. To get the same data points for a long list of entities in one file, use Excel Autofill.
6. Export data for many entities at once #
All the controls above export what is on your screen, one entity or one chart at a time. Excel Autofill works on a list. It takes up to 1,000 law firms, applicants or people and matches them against IP Pilot’s data. It returns one spreadsheet, with one tab for each chart you selected. Excel Autofill needs Pro.
Good to know #
- The exported file does not show which entity or filters it came from. Entity context was off. Export the chart again with the toggle on.
- A search export has exactly 1,000 rows. The search reached its limit, so the file is not complete. Add constraints until the banner goes away, then export again.
- No export icon on a dashboard. A chart on a dashboard has only an edit and a remove icon, and there is no dashboard-level export. Open the entity’s profile and export the chart from there.
Frequently Asked Questions #
Frequently Asked Questions #
Exports #
Which file formats can I export?
It depends on the control. The Export Chart dialog offers up to four formats: JPG, PDF, XLSX and SVG, with JPG selected by default. Some charts offer fewer. XLSX Table Export produces an XLSX spreadsheet only. Export Profile produces a PDF. Export Comparison in Compare Entities offers JPG, SVG, PDF and XLSX from a menu instead of a dialog.
Can I export the numbers behind a chart, not just the picture?
Yes. Choose the XLSX tab in the Export Chart dialog instead of JPG. The export is then a spreadsheet, not an image. SVG is also useful: it is a vector image, so you can resize it for a deck or a pitch document without loss of quality.
What does the Entity context toggle add to an export?
It writes the entity name and the applied filters into the file. For a profile that combines several entities, it also writes the list of those entities. On the JPG, XLSX and SVG tabs it is off by default, together with Header, Footer and Legend. On the PDF tab, all four start on. Switch it on so that the file still shows its source weeks later.
Does Preview PDF only show me a preview?
No. Despite the label, Preview PDF in the Export Profile dialog starts to build the full document. That is why you see Profile export in progress… instead of a preview. Choose your charts, Date Type and Paper Type before you click it.
Can I export a whole comparison from Compare Entities?
Not as one file. Each comparison chart has its own Export Comparison icon, with Download as JPG, Download as SVG, Download as PDF and Download as XLSX. You export a comparison one chart at a time. For the same data points on many entities in one file, use Excel Autofill.
Can Insights results be exported?
Yes. The result panels for Similar Entities, Network Overlap and Tech Overlap each have the same download icon as a profile chart. It opens the Export Chart dialog.
For an Insights table the dialog has fewer options: XLSX is the only format. JPG, PDF and SVG are grayed out, and there are no Header, Footer, Entity context or Legend toggles. You get the data, not a picture.
Compare Entities works differently: each comparison chart has its own Export Comparison menu with JPG, SVG, PDF and XLSX.
Can I export a dashboard?
No. There is no dashboard-level export, and a chart placed on a dashboard does not keep an export control. A widget header offers only an edit and a remove icon.
To export a chart you see on a dashboard, open the entity’s profile and export it from there.
Why does my search export stop at 1,000 rows?
Because Search shows at most 1,000 results, and the export contains the rows in the table. Search shows this banner: “Only showing most relevant 1000 results. Please add additional constraints if you want to narrow down your search.” To get a complete list, add constraints until the banner goes away. For data on a list of entities you already know, use Excel Autofill, which takes up to 1,000 entities per run.
Is export available on every subscription?
No. Export needs Standard or Pro. It is not available on trial access, and Excel Autofill needs Pro. If you are not sure what your firm’s license covers, ask your account manager.